Value Line Timeliness™ Mid Cap Value SMA

Mid-cap value companies typically provide more stability and income potential compared to growth stocks, and mid-cap companies tend to have less risk than small-cap companies and more room for appreciation than large-cap companies.
The Value Line Timeliness™ Mid Cap Value SMA provides growth potential by integrating the Value Line Ranking System for Timeliness™ with a multi-factor risk model that incorporates each stock’s risk profile and fundamental characteristics to construct a diversified portfolio.
Investment Objective
Capital Appreciation
Portfolio Characteristics
| Characteristic | Value |
|---|---|
| Number of Stocks | 71 |
| Average Market Cap | $28B |
| Dividend Yield | 1.35% |
| Trading Frequency | Monthly |
| Rebalancing Frequency | Monthly |
Investment Approach
Stocks in the Value Line Ranking System for Timeliness™ system are optimized against the Russell Midcap Value Index for possible inclusion in the portfolio. The optimization process selects stocks and determines their relative portfolio weighting, balancing risk and reward, as projected by the Value Line Ranking System for Timeliness™.
How Stocks Are Selected
The Portfolio will consist primarily of stocks meeting the following criteria:
- Stocks based in the U.S.
- Stocks in the Value Line Ranking System for Timeliness™ system are optimized against the Russell Midcap Value Index
- A multi-factor risk model is used to balance Value Line® Timeliness™ scores and portfolio risk
- The Portfolio generally consists of 50-70 stocks
- Portfolio is traded monthly
Top 10 Holdings (%) as of 09/30/26
| Company Name | Weight (%) |
|---|---|
| Marathon Petroleum Corp | 3.96% |
| Elevance Health Inc | 3.54% |
| SS&C Technologies Holdings Inc | 3.51% |
| General Motors Co | 3.21% |
| The Hartford Insurance Group Inc | 3.16% |
| EnerSys | 2.88% |
| Toll Brothers Inc | 2.67% |
| Hubbell Inc | 2.64% |
| FedEx Corp | 2.37% |
| The Travelers Companies Inc | 2.35% |
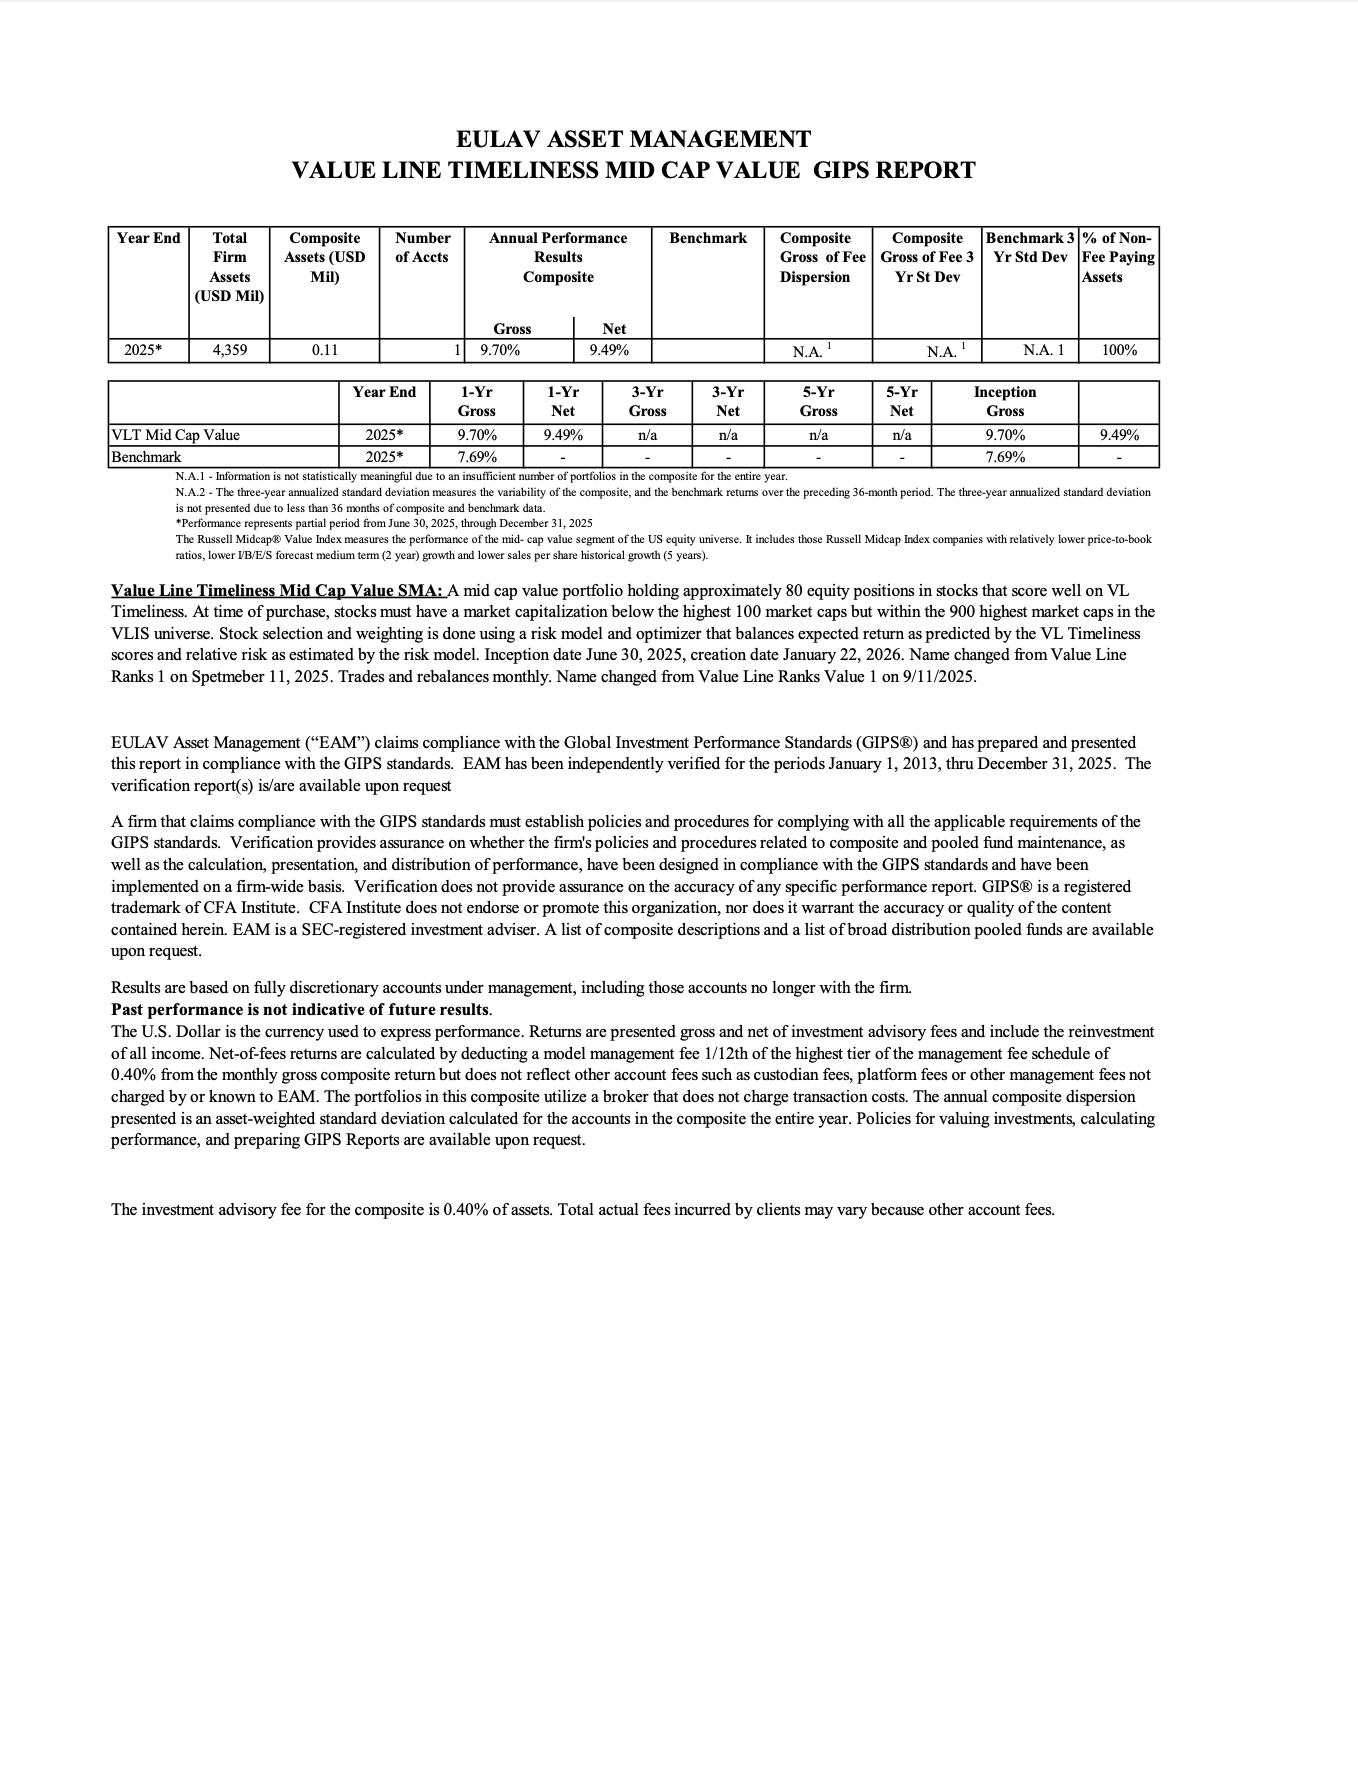
Performance as of 09/30/26
Sector Distribution as of 09/30/26
| Sector | Weight | |
|---|---|---|
| Industrials | 20.18% | |
| Technology | 19.94% | |
| Consumer Cyclical | 14.56% | |
| Healthcare | 13.98% | |
| Energy | 10.92% | |
| Financial Services | 10.68% | |
| Consumer Defensive | 5.60% | |
| Communication Services | 2.05% | |
| Cash | 1.79% | |
| Basic Materials | 1.58% | |
| Real Estate | 0.51% |
Source: Morningstar Direct
Portfolio Documents
Do you have questions?
Please reach out to our SMA support team at:
Crystal Barrett
Sales Director